For the most part what I learned during this project is the same thing I always learn when during a group project- people are difficult to organize with and manage. First, this is surprisingly not much more difficult online; true it is slightly more difficult as you have to wait for responses (which can take days), but all in all apathy is the same wether in person or through a computer. Secondly, it is just a matter of reality that there are those who will actively work toward a goal (even if it something they are not horribly interested in), those who do the bare minimum, and those who free ride and drag others down. Finally, most people are followers who will wait for someone to take the reins and tell them what to do, and if that person is not expressly specific in what they tell people those people (even if there are explicit instructions given to all) will inevitable place that onus onto the person who inevitable did what needed to be done.
Sorry for the rant, but I loathe group projects unless I get to choose who I want to work with, at least (and even then not so much)-- I know this is not always possible in the world; however, in the real world people are getting paid and that is a powerful tool in getting people to care about the final product and the initial effort.
Finally, I did learn a few things while doing this project. First, I learned what Google Alerts are-- pretty cool stuff that I'm sure I will be able to make great use of. It reminds me of RSS feeds but Internet Wide and subject specific, great idea! I also learned a lot about how social media can be used as a tool. Before last weeks lesson I still looked at social media and a personal vehicle for communication-- even though I have been getting used to corporations making use of the for a couple of years now. But after this project I can take a step back and actually analyze how well a firm is using social media to interact with consumers.
I for one, do not like being talked to by a company (as in traditional advertising), but to have a company offer interaction, or more specifically the power to opt in or out, even I am incline to look at a website for a company I do like. (this is truly profound as I have been an avid reader of Adbusters for over 10 years.
We covered all of the social media and web 2.0 heavy hitters and their use by EA (Electronic Arts): Facebook, Twitter, Twitrater, Google, Bing, Flickr, Instagram, Wikipedia, and Youtube. What I found most interesting, however, was the use of Flickr and Instagram to give users a window to see inside the offices of EA and from the point of view of the employees. I find this interesting because I don't think that it is necessarily the idea of the company to do this, but more of a spontaneous thing employees have don. It is an interesting perspective.
You can find the Wiki report here: https://ism3004.wikispaces.com/Electronic+Arts
Showing posts with label project. Show all posts
Showing posts with label project. Show all posts
Sunday, November 27, 2011

Thursday, October 20, 2011
Excel Project Week 8-9
 Mr. Olsen called Microsoft Excel a “Swiss army knife” of computer programs. After working with the program, I am inclined to agree. I was often amazed with just what can be done with the program, and how accessible and easy it was to use.
The project we were given was to take raw data for 1,000 participants in a 20-minute exercise routine at a fitness center. Then, we were to manipulate it in order to ascertain multiple facts that could be derived from that data. Information provided was the age and sex of subjects, their beginning heart rate, and their heart rate at each minute mark throughout the routine.
Next, we were to determine, using both numerical and logical formulas, certain aspects of this data. The maximum heart rate for each participant was to be determined first. Then, we were to determine the target hear rate for each participant. We used this data to determine if participants reached their target, designated by “yes, or “no”, by pulling out each participant’s highest heart rate achieved and then applying a logical formula. Finally, we were to determine the percent of increase for heart rate, for each participant throughout their routine.
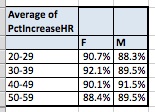
Finally we were to create to pivot tables used to analyze certain characteristics of the data. The first pivot table concerned the number of participants, separated by gender, who both reached and did not reach the target heart rate. Also, an aggregate of the combined sexes was to be displayed. The second pivot table, which can be seen above, was to display the average percentage of heart rate increase of each age group (broken down by 10-year increments), separated by gender.
I personally found this project to be a lot of fun. I was constantly amazed by the capabilities of the program. I even called family members who work in offices and offered to show them some new tricks. I did, however, have some issues. I recently bought a MacBook Pro, as requested of the journalism college, and obtained a copy of MS Office for Mac 2011. Though this version is, in my opinion, more efficient and easier to use than its PC counterpart, the instructional videos were for PC. I had to discover shortcuts and ribbon/menu pathways on my own.
This, for the most part, was not a horrible problem; however, some issues, like taking a screen shot or determining how a pivot table should analyze the data, were very different from the PC program. Though it took a while to figure such things out, I did come to the determination that they were difficult to figure out because they were more simple, while I was hunting for some complicated process. End of story, I recommend the Mac version of Excel.
Subscribe to:
Posts (Atom)